



August 2026 Market Review
If you spent the final weeks of summer watching financial headlines, you may have noticed a distinct shift in tone. The extraordinary second-quarter corporate earnings reporting cycle has drawn to a close, and investor focus has pivoted toward a two-sided macroeconomic and political debate. August itself proved exceptionally resilient: the S&P 500 rose 2.7% and the Nasdaq-100 gained 4.2%, locking in their strongest August performances since 2021. Yet beneath this surface momentum lies a market balancing on the edge of a coin flip.
The asset class performance quilt below highlights returns across a broad range of asset classes over the past decade. While leadership shifts from year to year, the quilt underscores how diversified portfolios help smooth performance across full market cycles.
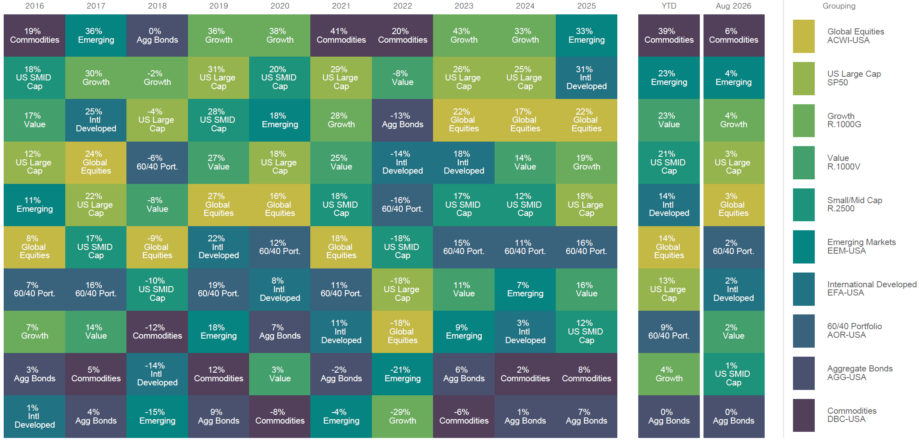
Source: FactSet, as of August 31, 2026. Past performance is not indicative of future results.
AUGUST MARKET HIGHLIGHTS
- Commodities Extend Leadership: Commodities gained 6% in August, bringing year-to-date returns to 39%. We launched a liquid alternatives strategy earlier this year that allocates to commodities alongside other non-correlated risk diversifiers. While intended as a permanent strategic allocation, we believe the current environment may warrant consideration of liquid alternatives as one component of a diversified portfolio. Please connect with your advisor or our investment team to explore the strategy.
- Emerging Markets Keep Pacing Equities: Emerging markets gained 4% in August (and 23% year-to-date), buoyed by dollar weakness and ongoing strength across Asian technology hardware hubs.
- Growth and Tech Reassert Control: Large-cap Growth advanced 4%, snapping a two-month losing streak as software surged and hyperscalers stabilized following July’s correction.
- Value Moderates: Large-cap Value gained 2%. Value’s longer-term leadership remains solid, up 23% year-to-date versus 4% for Growth.
- Fixed Income Pauses: Aggregate Bonds finished flat at 0%. Upward pressure on yields across the curve balanced coupon income against price pressure.
THE ANATOMY OF A 50/50 ENVIRONMENT
As portfolio strategists, our task is to evaluate probabilities objectively rather than relying on traditional survey methods. Prediction markets like Polymarket are one of several indicators we monitor, offering real-time pricing on collective expectations with real capital at stake. Today, those prediction gauges are pricing two crucial inflection points as virtual coin flips.
Consider monetary policy. Following Fed Chair Kevin Warsh’s hawkish Jackson Hole address reaffirming the 2% inflation target, Polymarket odds for the September 16 FOMC meeting sit at 52% for a 25 basis point rate hike versus 48% for no change.
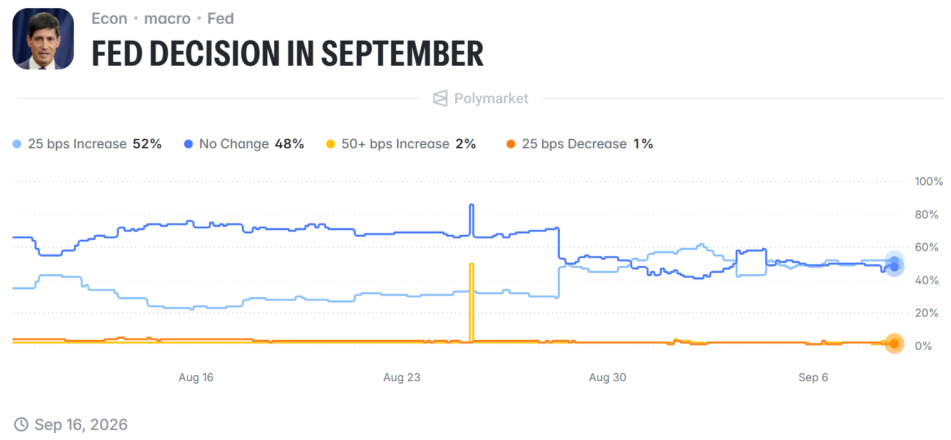
Source: Polymarket.us as of Sep. 8, 2026.
A parallel coin flip appears on the political horizon. Polymarket currently prices control of the U.S. Senate at 53% Republican and 48% Democrat. When the path of central bank policy and the balance of legislative power in Washington are both dead heats, the potential for market repricing increases substantially.
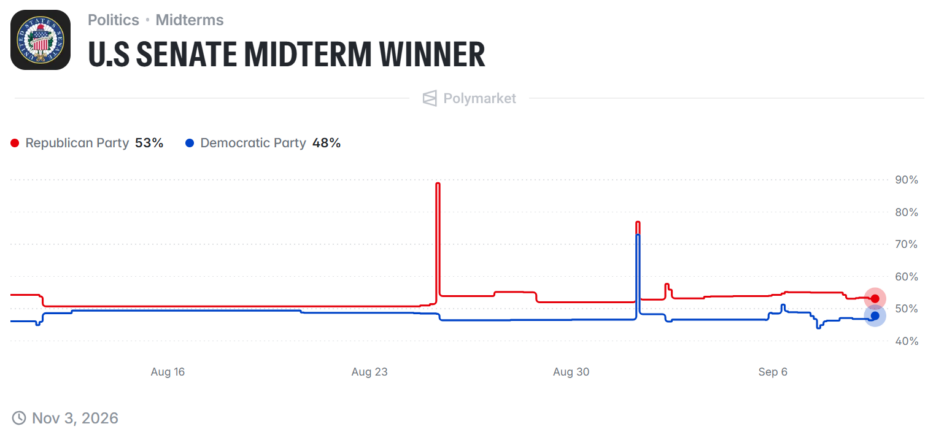
Source: Polymarket.us as of Sep. 9, 2026.
COMPLACENCY MEETS MIDTERM SEASONALITY
Despite these looming coin flips, public markets are pricing in little turbulence. The CBOE Volatility Index (VIX), often called the market’s fear gauge, has compressed toward 14, hovering near its lowest levels of the year. Other times the VIX has reached levels this low, it has been followed by choppy, digestive market action rather than smooth upward continuation. Although, This pattern has not held in every instance, and low volatility readings do not reliably predict future market direction.
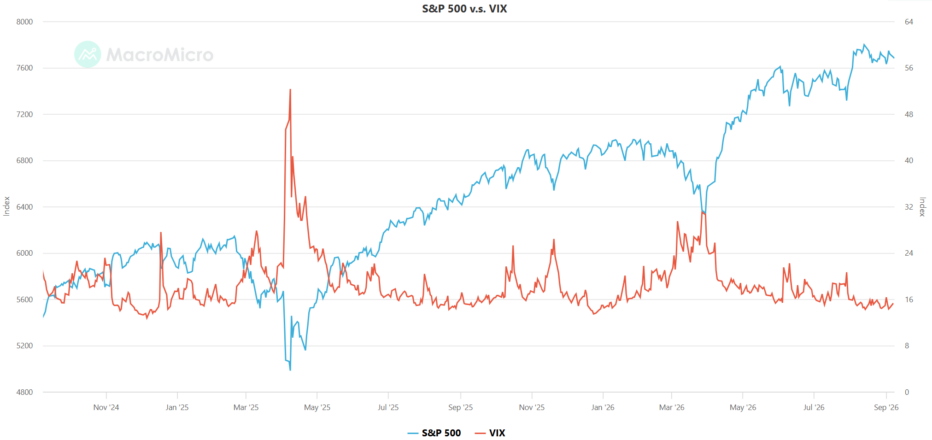
Source: MacroMicro.me as of Sep. 7, 2026. The Volatility Index (VIX) is a widely used measure of market volatility, often referred to as the “fear gauge”. It represents investor expectations for short-term volatility, derived from the prices of S&P 500 options. A high VIX typically indicates increased market uncertainty, while a lower VIX suggests calmer or complacent market conditions.
Seasonality points in the exact same direction. As the historical data suggests, the S&P 500 frequently experiences a notable pickup in volatility during late summer and early autumn of midterm election years. Median volatility typically climbs from 17.5% in August to 19.0% in September and peaks at 24.5% in October before easing once election results are finalized.
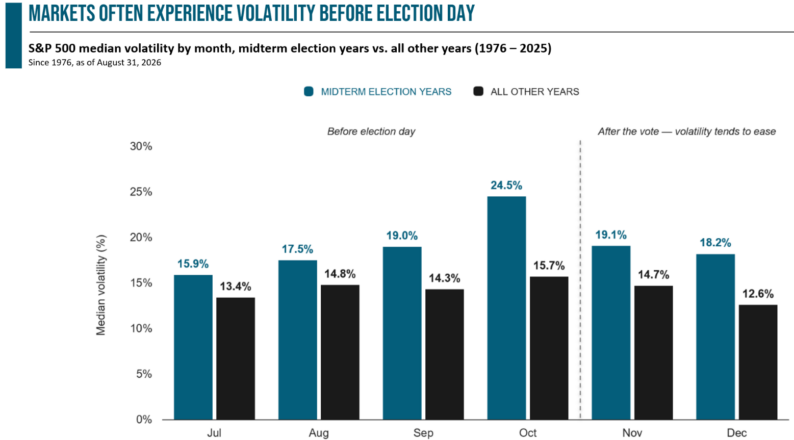
Source: Morningstar, analysis by Lincoln Financial. Median standard deviation of daily returns by month in midterm election years vs. years without a midterm election. Analysis as of 12/31/2025. Federal Election Day falls on the Tuesday after the first Monday in November; the dashed marker approximates its position on a monthly chart. November is classified as a post-election (“after the vote”) month. Past performance does not guarantee or predict future performance.
NAVIGATING THE ROAD AHEAD
While near-term crosscurrents may prompt a pickup in volatility, historical precedent offers useful context. Midterm election-year chop is a routine seasonal dynamic rather than a sign of structural deterioration. In fact, following every midterm election since 1950, the S&P 500 has been positive one year later, delivering an average forward return of 16.6%.
Corporate earnings remain our guiding compass. Second-quarter earnings grew roughly 33%, with upward revision paths running at their steepest trajectories in over two decades. Because underlying corporate fundamentals remain exceptionally sturdy, we believe a pullback in the weeks ahead could present an opportunity, for investors whose objectives and risk tolerance support it, to add to equity positions; however, pullbacks may deepen or persist, and equity investments can lose value.
Enjoy the transition into autumn, stay disciplined through upcoming political debates, and know our team is always here to guide your portfolio through every market cycle.

DISCLOSURES
This commentary is provided by SAX Wealth Advisors, LLC, an SEC-registered investment adviser, for informational and educational purposes only. Registration of an investment adviser does not imply any specific level of skill or training and does not constitute an endorsement of the firm by the Securities and Exchange Commission. It does not constitute investment, tax, or legal advice and should not be relied upon as the basis for any investment decision. The views expressed reflect the opinion of SAX Wealth Advisors as of the date of publication and are subject to change without notice.
Index, sectors, and asset class returns referenced are total returns of unmanaged market indices and do not represent the performance of any SAX Wealth Advisors client account, composite, or model portfolio and do not reflect the performance of any actual investment. Indices cannot be invested in directly and do not reflect the deduction of advisory fees, transaction costs, or taxes. There can be no assurance that current investments will be profitable. Actual realized returns will depend on, among other factors, the value of assets and market conditions at the time of disposition, any related transaction costs, and the timing of the purchase. Indexes may not directly correlate or only partially relate to any specific portfolio or may not be represented in a portfolio at all.
This document contains forward-looking statements relating to the objectives, opportunities, and the future performance of the U.S. market generally. Forward-looking statements may be identified by the use of such words as “believe,” “expect,” “estimated,” and other similar terms. Examples of forward-looking statements include estimates with respect to financial condition, results of operations, and success or lack of success of any particular investment strategy. All are subject to various factors, including general and local economic conditions, changing levels of competition within certain industries and markets, changes in interest rates, changes in legislation or regulation, and other economic, competitive, regulatory and technological factors affecting a portfolio’s operations that could cause actual results to differ materially from projected results. Such statements are forward-looking in nature and involve known and unknown risks, and accordingly, actual results may differ materially from those reflected or contemplated in such forward-looking statements. Investors are cautioned not to place undue reliance on any forward-looking statements or examples.