



October 2026 market review
Market data as of October 31, 2026; earnings and election data as of November 6, 2026.
October featured a sharp rotation across financial markets. While the S&P 500 (-1%) and Nasdaq Composite (-5%) slipped, the equal-weighted S&P 500 gained 5% as investors rotated from mega-cap tech into cyclical and value segments. That repositioning collided with the midterms, where a Democratic sweep of Congress under a Republican White House was followed by a sharp selloff and a volatility spike. Yet, as the charts below illustrate, both elevated fear readings and this specific divided-government setup have historically been followed by positive forward returns, although past performance is not indicative of future results.
The asset class quilt below highlights returns over the past decade, year-to-date, and through October 2026, illustrating how diversification smooths returns across cycles.
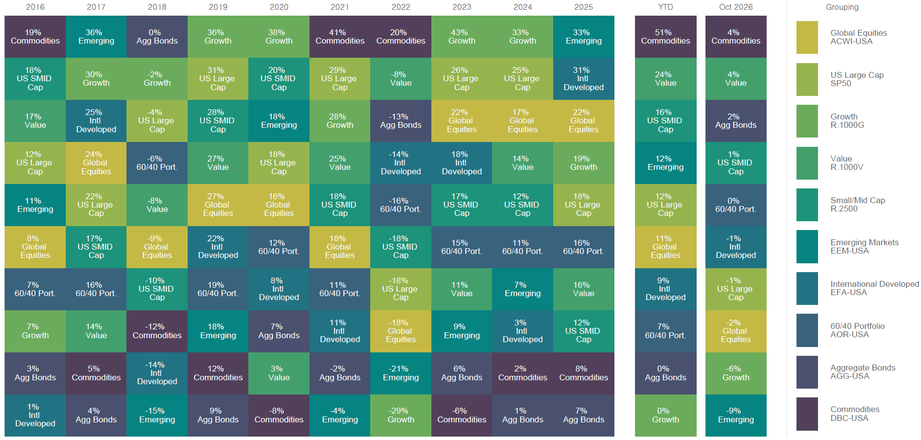
Source: FactSet, as of October 31, 2026. Asset classes are represented by the following index/ETF proxies shown to the right of the ‘quilt’. ETF proxy returns reflect fund expenses; index returns do not. Neither reflects SAX advisory fees. Past performance is not indicative of future results. Index and ETF proxy returns are for illustration only and are not SAX client or model portfolio performance. See full disclosures.
OCTOBER MARKET HIGHLIGHTS
- Value Outperforms Growth: Russell 1000 Value (+4%) beat Russell 1000 Growth (-6%) by 10 percentage points, extending Value’s year-to-date gain to 24% while Growth finished flat for the year (0%).
- Commodities Extend YTD Lead (+4% in Oct; +51% YTD): Ongoing Middle East conflict and Strait of Hormuz supply threats pushed Brent crude up 14% to $118 per barrel.
- Treasury Yields Reverse: After reaching a high of 5.36%, the 10-year Treasury yield dropped more than 40 basis points to close at 4.93% (2-year at 4.59%). U.S. Aggregate Bonds (+2%) provided portfolio ballast as equity volatility rose.
- Earnings Power Remains Intact: Per FactSet (88% reporting), S&P 500 blended Q3 earnings growth was 31% year-over-year, marking three consecutive quarters above 25% with an 84% beat rate. As profit growth outpaced consolidating prices, forward P/E compressed to 17.7x, below 5-year (19.8x) and 10-year (19.1x) averages.
MIDTERM OUTCOMES: HISTORY AFTER THE DEMOCRATIC SWEEP
Early November brought sharp post-election turbulence. On November 5, equities recorded their steepest single-day decline since April 2025: the S&P 500 dropped 4%, the Nasdaq fell 6%, and the Dow fell 3%.
Prediction markets anticipated a blue wave, so shifting legislative control was not unexpected. The surprise was the sheer magnitude: a “blue tsunami” flipped seats and states few forecasters imagined viable.
While our Q3 2026 Market Review highlighted the market’s strong one-year track record following midterms, the updated study below shows that historically, post-election gains have often appeared within a compressed window of roughly seven to eight months, with the S&P 500 advancing from Election Day through June 30 in all 19 midterms since 1950 (averaging +16% price return).
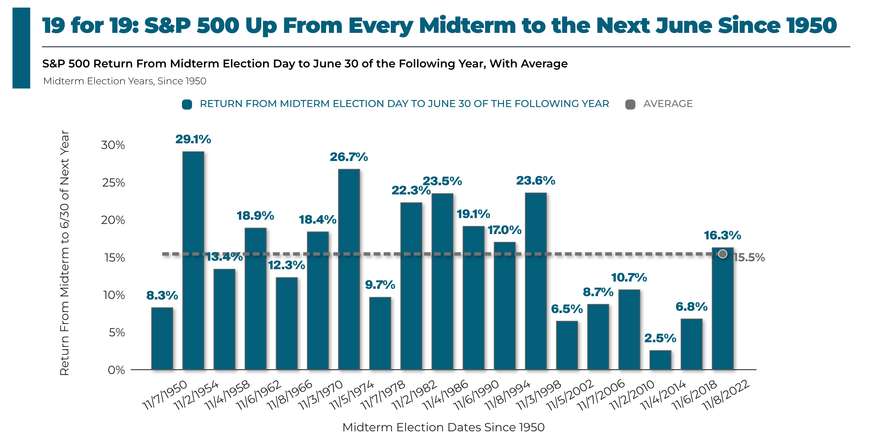
Source: Exhibit A, FactSet Research Systems Inc., Standard & Poor’s. Past performance is not indicative of future results. See full disclosures.
Does this specific outcome alter the historical pattern? Midterms delivered a Democratic sweep of both chambers under a Republican president. While unified opposition often sparks near-term unease, history, if continued, tells a reassuring story.
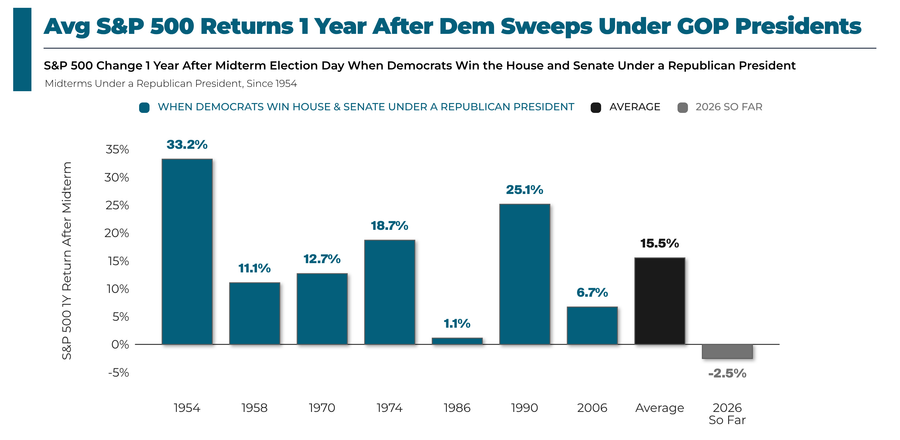
Source: Exhibit A, FactSet Research Systems Inc., Standard & Poor’s, as of November 6, 2026. Past performance is not indicative of future results. See full disclosures.
Across all seven midterms since 1954 featuring this exact balance of power (1954, 1958, 1970, 1974, 1986, 1990, and 2006), the S&P 500 was higher one year later in all seven instances, delivering an average gain of 16%. In our view, divided government may increase legislative gridlock, which can reduce the likelihood of sweeping legislative change and may offer greater regulatory predictability.
VOLATILITY AND CONTRARIAN FORWARD RETURNS
Beyond legislative dynamics, the sudden post-election selloff triggered an acute spike in sentiment measures, visible in the short-term trajectory of the market’s primary gauge of fear.
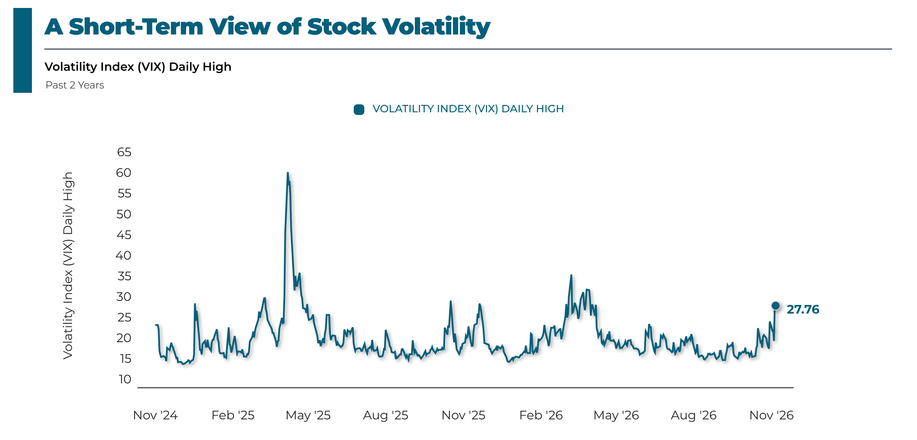
Source: Exhibit A, FactSet Research Systems Inc., Standard & Poor’s, Cboe Global Markets, as of November 6, 2026. Past performance is not indicative of future results. See full disclosures.
In our August 2026 Market Review, we noted that a compressed CBOE Volatility Index (VIX) near 14 was signaling complacency ahead of looming policy coin flips and seasonal autumn chop. Today, markets confront the exact opposite condition. When the VIX spiked to a daily high of 27.76 post-election, it entered a heightened fear band (26.1-28.7) that historically has been followed by an average six-month S&P 500 forward return of +6% since 1990. As sentiment swings from complacency to fear, historical precedent suggests these spikes have at times preceded market recoveries; however, elevated volatility can also persist or increase, and each investor’s situation is different.
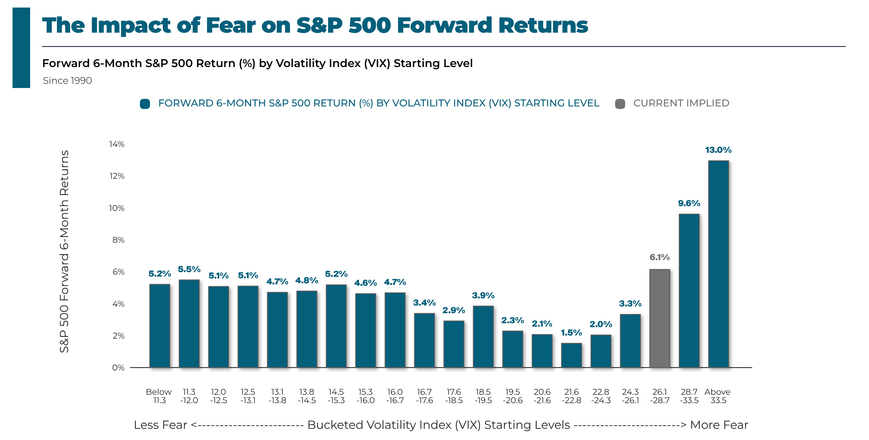
Source: Exhibit A, FactSet Research Systems Inc., Standard & Poor’s, Cboe Global Markets, as of November 6, 2026. Past performance is not indicative of future results. See full disclosures.
THE FUTURE OF AI: STATE-LEVEL DIVERGENCE & COMMUNITY COMPACTS
Technology entered November following a 10% October pullback, with post-election selling extending the retreat as investors reassessed heavy hyperscaler debt and capex budgets. With a Democratic Congress taking shape, many ask if the AI trend is ending.
In our view, the trend remains intact, but may be shifting to a localized, selective phase:
- State-Level Bifurcation: Potential federal gridlock could stall national legislation, shifting policy to the states. Power-rich states with deregulated utilities may market themselves as AI havens, while regions with strained grids may impose moratoriums and environmental tariffs.
- Community Compacts & Toll Roads: Heavy demands on local water and power are fueling grassroots pushback. Tech developers may increasingly face local requirements for profit-sharing agreements, direct payments, or dedicated microgrid investments to secure permits.
These frictions could raise hurdle rates for marginal operators while strengthening the moats of well-capitalized leaders. Notably, Technology’s forward valuation premium over the S&P 500 has declined from 35% last year to an outright discount following post-election selling, marking a ten-year relative low even as tech earnings momentum has been approximately twice that of the broader index.
NAVIGATING THE ROAD AHEAD
Elections and sharp sector rotations create noisy headlines, but we believe earnings, valuations, and interest rates drive long-term wealth. With Q3 earnings compounding above 31%, multiples normalizing to 17.7x, and core bonds providing portfolio ballast, we believe the macro foundation remains solid. For investors whose objectives and risk tolerances support it, post-election volatility may offer an opportunity to rebalance into diversified portfolios aligned with primary structural trends.

DISCLOSURES
This commentary is provided by SAX Wealth Advisors, LLC, an SEC-registered investment adviser, for informational and educational purposes only. Registration does not imply any specific level of skill or training. It does not constitute investment, tax, or legal advice and should not be relied upon as the basis for any investment decision. The views expressed are those of the author as of the date noted and are subject to change without notice. Index and ETF proxy returns are unmanaged, cannot be invested in directly, do not reflect advisory fees (ETF proxy returns reflect fund expenses; index returns do not reflect transaction costs or taxes), and do not represent the performance of any SAX Wealth Advisors client account or model portfolio. Diversification does not guarantee a profit or protect against loss. Historical relationships, VIX studies, and midterm-election statistics are based on past data and limited sample sizes, may not repeat, and are not a guarantee of future results. This document contains forward-looking statements subject to known and unknown risks that could cause actual results to differ materially. References to political outcomes are for market-analysis purposes only and do not represent political endorsements.