



Q3 2026 Market Review
The third quarter of 2026 delivered an intense macroeconomic stress test for financial markets. Geopolitical frictions reignited as the Middle East conflict pushed Brent crude back above $100 per barrel. In response to stubborn headline pressures, a vast majority of developed-market central banks enacted policy rate hikes, headlined by the Federal Reserve raising the federal funds rate for the first time in three years to 3.75%–4.00%.
Yet, public markets continued to act as an efficient forward-looking mechanism. While headline benchmarks finished near record territory (the S&P 500 closed the quarter up 2% and just 2% off its 52-week peak), beneath the surface, markets underwent a sharp internal correction.
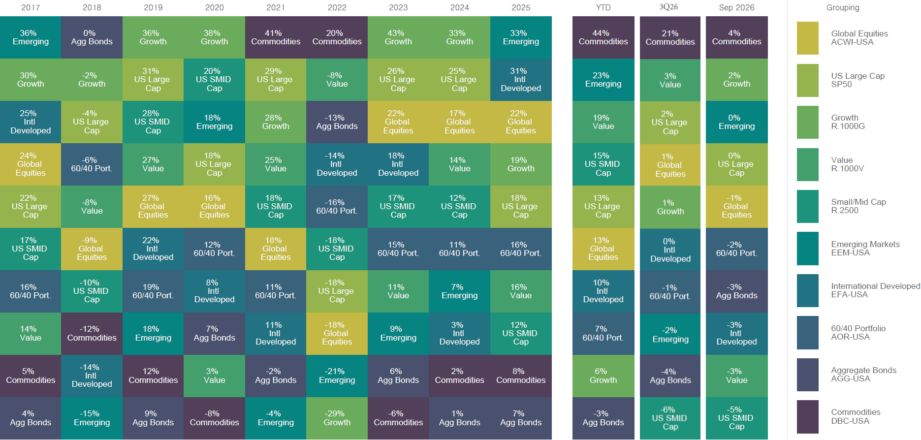
Source: FactSet, as of September 30, 2026. Past performance is not indicative of future results.
THIRD QUARTER & SEPTEMBER MARKET HIGHLIGHTS
- Commodities Extend Dominance (+21% in 3Q; +44% YTD): Commodities led all asset classes in Q3, gaining 21% (+4% in September) to push year-to-date returns to 44%. Stalled diplomatic negotiations in the Middle East and a broader flight toward monetary debasement hedges continued to lift energy and metals prices.
- Cap-Weighted Benchmarks Mask Internal Correction: The headline S&P 500 finished flat (0%) in September, but the equal-weight index, mid-caps, and small-caps fell. In fact, 83% of S&P 500 constituents closed the month down more than 10% from their 52-week highs, and 42% are down more than 20%.
- Small and Mid-Caps Stumble on Rate Pressure: The Russell 2500 retreated 5% in September, bringing US SMID Cap returns to -6% for the third quarter as higher refinancing costs weighed on rate-sensitive businesses.
- Large-Cap Growth Rebounds (+1% in 3Q; +2% in Sep): Growth reasserted relative strength into the quarter’s close, driven by Technology (+4.5%) and Communications (+4.3%).
- Fixed Income Faces Duration Headwinds (-4% in 3Q; -3% in Sep): Yields surged across the curve, driving Aggregate Bonds down 4% in Q3 and pushing year-to-date performance to -3%.
WHERE VOLATILITY WENT: FIXED INCOME AS THE PRESSURE VALVE
In our August Market Review, we highlighted the historical tendency for volatility to climb during the late summer and autumn of midterm election years. Earlier this spring in our May Market Review, we also examined how financial markets very often tend to test new Federal Reserve leadership, noting that the year following a new Fed Chair historically experiences an average intra-year drawdown of 17.5%.
What makes this cycle fascinating is the venue in which that turbulence has materialized. Historically, investors expected election-year anxiety and central bank transitions to trigger deep drawdowns in the equity market. This time, the equity market has absorbed the shock while the fixed income market has acted as the primary pressure valve.
Rather than stocks breaking down, soaring interest rates have become the true focal point of market volatility.
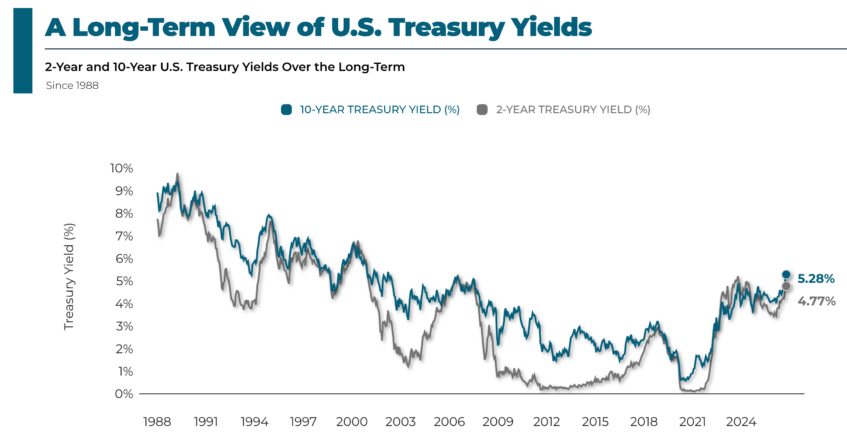
Source: Exhibit A, FactSet Research Systems Inc., as of October 7, 2026.
As illustrated above, Treasury yields have pushed to multi-decade milestones. In September, the 10-year Treasury yield surged to 5.28%, its largest monthly net increase in four years, while the 2-year yield climbed to 4.77%. At the ultra-long end, the 30-year yield advanced to 5.62%, touching levels not seen since 2002.
This rate acceleration has been fueled by a collision of forces: accelerating headline inflation tied to $100 oil, the Fed’s September rate increase, massive federal deficits, and unprecedented corporate debt issuance. U.S. tech hyperscalers have issued over $200 billion in long-term debt this year alone to fund the artificial intelligence infrastructure buildout, competing directly against government paper for long-duration capital.
Higher borrowing costs across the economy have tightened financial conditions, disproportionately penalizing businesses that rely on debt financing or floating-rate loans. While headline indices held steady, internal breadth softened, with nine of the 11 large-cap sectors and 10 of the 11 small-cap sectors closing lower on the month.
ALLAYING BOND FEARS: STARTING YIELDS AS A FORWARD COMPASS
Seeing bond prices decline can be frustrating, especially when fixed income is intended to provide portfolio ballast. With the Fed expected to continue raising rates into early 2027, rate volatility could certainly persist over the coming months or quarters. However, when we zoom out and look past immediate rate moves, today’s elevated yields provide a historically strong starting point for long-term forward returns., relative to the past, offers a high starting yield, a condition that has historically been associated with higher subsequent bond returns.
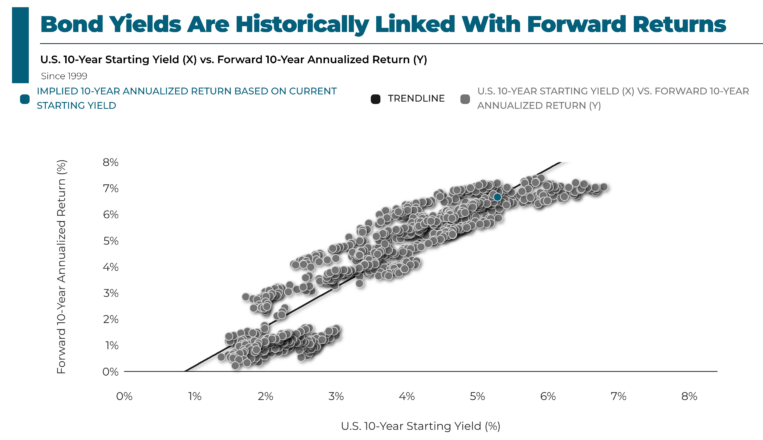
Source: Exhibit A, FactSet Research Systems Inc., as of October 7, 2026.
As demonstrated in the historical regression above, starting bond yields have a tightly correlated relationship with subsequent 10-year annualized returns. When starting yields hovered near 1% to 2% during the post-crisis era, prospective returns were mathematically capped at meager levels.
Today, with the 10-year Treasury yield near 5.28%, the implied 10-year forward annualized return sits comfortably between 6% and 7%. Furthermore, elevated starting coupons may provide a protective cushion against further price decline, assuming yields don’t rise materially, leading to low or negative returns. Even if yields drift moderately higher from here, the regular cash flow generated by today’s coupons could act as a shock absorber against additional price declines, contingently positioning fixed income to be a dependable, high-quality performer over the long run.
THE EARNINGS FOUNDATION: WHY VALUATIONS HAVE COMPRESSED
While soaring yields have driven fixed income turbulence, corporate earnings power has kept equities afloat. Crucially, broad equity gains this year have been powered largely by organic earnings growth rather than multiple expansion. The forward price-to-earnings (P/E) ratio for the S&P 500 has compressed from roughly 23x down to 19x, bringing broad market multiples back in line with historical baselines.
This multiple compression is even more visible in technology, where forward multiples dropped from 32x to 21x, narrowing tech’s valuation premium over the broader market to about 10%. Anxiety regarding substantial debt issuance and AI capital expenditures appear to largely be reflected in share prices. We would always prefer a resilient economy capable of handling higher borrowing costs over an anemic economy requiring emergency central bank rate cuts.
NAVIGATING THE ROAD AHEAD
Heading into the final quarter of the year, we expect the collision of elevated yields, midterm election rhetoric, and geopolitical developments to produce periodic bouts of turbulence. Historical data indicates that equity market volatility frequently peaks during October of midterm election years before easing once political clarity emerges.
For long-term investors, history provides a reassuring precedent. Following every single midterm election since 1950, the S&P 500 has posted positive returns 12 months later, delivering an average forward gain of 16.6%. That being said, past performance is not indicative of future results.
Supported by resilient corporate earnings, normalizing valuations, and higher bond yields, periods of weakness may offer an opportunity to add to diversified portfolios for investors whose objectives and risk tolerances support it. Our team remains focused on keeping your wealth aligned with these primary structural trends.

DISCLOSURES
This commentary is provided by SAX Wealth Advisors, LLC, an SEC-registered investment adviser, for informational and educational purposes only. Registration of an investment adviser does not imply any specific level of skill or training and does not constitute an endorsement of the firm by the Securities and Exchange Commission. It does not constitute investment, tax, or legal advice and should not be relied upon as the basis for any investment decision. The views expressed reflect the opinion of SAX Wealth Advisors as of the date of publication and are subject to change without notice.
Returns shown are total returns of the market indices and exchange-traded fund (ETF) proxies identified in the key above. Index returns are unmanaged, indices cannot be invested in directly, and index returns do not reflect advisory fees, transaction costs, or taxes. ETF returns are net of fund expenses but do not reflect brokerage commissions, advisory fees, or taxes. None of the returns shown represents the performance of any SAX Wealth Advisors client account, composite, or model portfolio, including the 60/40 ETF proxy. There can be no assurance that current investments will be profitable. Actual realized returns will depend on, among other factors, the value of assets and market conditions at the time of disposition, any related transaction costs, and the timing of the purchase. Indexes may not directly correlate or only partially relate to any specific portfolio or may not be represented in a portfolio at all.
Diversification does not guarantee a profit or protect against loss. All investing involves risk, including possible loss of principal. Bond prices generally fall when interest rates rise. Historical relationships and statistics, including the Treasury yield regression and midterm-election returns, are based on past data, may not repeat, and are not a guarantee of future results.
This document contains forward-looking statements relating to the objectives, opportunities, and the future performance of the U.S. market generally. Forward-looking statements may be identified by the use of such words as “believe,” “expect,” “estimated,” and other similar terms. Examples of forward-looking statements include estimates with respect to financial condition, results of operations, and success or lack of success of any particular investment strategy. All are subject to various factors, including general and local economic conditions, changing levels of competition within certain industries and markets, changes in interest rates, changes in legislation or regulation, and other economic, competitive, regulatory and technological factors affecting a portfolio’s operations that could cause actual results to differ materially from projected results. Such statements are forward-looking in nature and involve known and unknown risks, and accordingly, actual results may differ materially from those reflected or contemplated in such forward-looking statements. Investors are cautioned not to place undue reliance on any forward-looking statements or examples.
None of SAX Wealth Advisors or any of its affiliates or principals nor any other individual or entity assumes any obligation to update any forward-looking statements as a result of new information, subsequent events or any other circumstances. All statements made herein speak only as of the date that they were made. Certain information has been obtained from third-party sources believed to be reliable; however, SAX Wealth Advisors does not guarantee its accuracy or completeness.